
Issue Brief
Thematic Area: Trade, Investment, and Resilient Supply Chains

Global Trends in Services Exports: Rethinking Measurement and Bridging Data Gaps
Introduction: Trends in Services Exports 2025
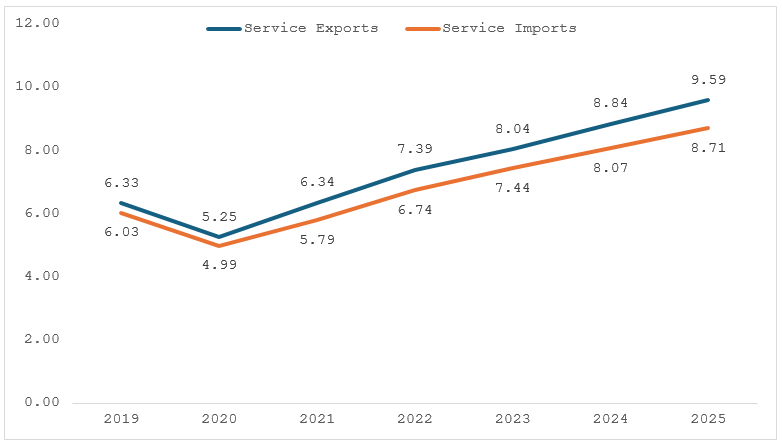
Despite geopolitical headwinds and trade policy uncertainty, services trade, which accounted for 27.60% in global merchandise and services trade, increased by 7.16% from USD 6.33 trillion in 2019 to USD 9.59 trillion in 2025. Global merchandise trade, on the other hand, expanded by 5.53% from USD 19.00 trillion in 2019 to USD 26.25 trillion in 2025.1 This reflects a gradual servicification of trade, where firms increasingly integrate services in their manufacturing process, such as use of knowledge-based service and digital platforms to streamline their production processes. Global service imports increased from USD 6.03 trillion in 2019 to USD 8.71 trillion in 2025 at an annualized rate (CAGR) of 6.32%.
Global Service Exports and Imports (USD trillion, 2019-2025)
Source: WTO Stats
From a sectoral perspective, other commercial services account for the largest share of global services trade, followed by travel, transport, and goods-related services. Since 2019, the share of other commercial services has increased significantly, rising from USD 3.54 trillion to USD 5.78 trillion in 2025. In contrast, the share of travel services declined from 23% to 19% over the same period. The shares of transport and goods-related services have remained relatively stable.
Trends in Services Exports by Service Type (USD trillion, 2019-2025)
Source: WTO Stats (Assessed on 25 June 2026)
Compound Annual Growth Rate (CAGR) in Services Exports (2019-2025)
| Product/Sector | Compound Annual Growth Rate (CAGR) (%) |
|---|---|
| Goods-related services | 6.67 |
| Transport | 6.36 |
| Travel | 4.07 |
| Other commercial services | 8.52 |
Source: Author's calculations based on data from WTO Stats
Region-wise Trends in Service Exports
From a regional perspective, services exports are highly concentrated in Europe, accounting for nearly half of total commercial services exports. This leadership is driven primarily by strong performance in other commercial services, as well as substantial contributions from transport and travel. Asia ranks second, exhibiting a balanced distribution across transport, travel, and other commercial services. The Middle East accounts for 4.67%, while South and Central America and the Caribbean and Africa remain minor players with limited diversification. The CIS region contributes the smallest share.
Therefore, there is a need to promote diversification into other commercial services in underrepresented regions such as Africa, South and Central America, and the CIS. Investments in digital infrastructure, skills development, and regulatory support remain the need of the hour, enabling these regions to expand their export base and improve their participation in global services trade.
Region and Sector-Wise Distribution of Service Exports (USD Trillion) and Share in Total Services (%), 2025
| Regions | Goods-related services | Transport | Travel | Other commercial services | Total Commercial Services |
|---|---|---|---|---|---|
| Europe | 0.19 (1.94) | 0.72 (7.54) | 0.77 (8.08) | 3.08 (32.22) | 4.76 (49.79) |
| Asia | 0.08 (0.85) | 0.46 (4.79) | 0.47 (4.94) | 1.37 (14.38) | 2.38 (24.96) |
| North America | 0.05 (0.51) | 0.13 (1.35) | 0.30 (3.14) | 0.97 (10.13) | 1.45 (15.13) |
| Middle East | 0.01 (0.06) | 0.11 (1.19) | 0.16 (1.67) | 0.17 (1.74) | 0.45 (4.67) |
| South and Central America and the Caribbean | 0.01 (0.09) | 0.04 (0.41) | 0.09 (0.99) | 0.10 (1.00) | 0.24 (2.48) |
| Africa | 0.01 (0.11) | 0.04 (0.46) | 0.07 (0.70) | 0.05 (0.56) | 0.17 (1.83) |
| Commonwealth of Independent States (CIS) | 0.01 (0.06) | 0.04 (0.38) | 0.03 (0.30) | 0.04 (0.40) | 0.11 (1.14) |
| Total | 0.35 (3.62) | 1.54 (16.13) | 1.89 (19.82) | 5.78 (60.44) | 9.56 (100.00) |
Source: Author's calculations based on data from WTO Stats; Note: Figures in brackets reflect share in total service exports (%); (Assessed on 25 June 2026)
Trade Asymmetry: A Persistent Challenge in Bilateral Services Data
This issue brief provides an insight into the complex measurement mechanism of bilateral services data and briefly provides the way forward for reducing significant data gaps and informational asymmetries. The services sector plays a crucial role in facilitating goods export; however, this contribution is often not adequately reflected in measured services exports.
The key issue is the scarcity of reliable data on the value added by services, as well as limited insights into how existing trade, industrial, and services policies influence or support the contribution of services-value added within exports.2 In this context, it is imperative to define the concept of trade asymmetry.
Ideally, services exports reported by country A to country B should match the services imports recorded by country B from country A. However, in practice, this is often not the case. This gap, known as trade asymmetry, often results from complex challenges in measuring trade in services due to various interrelated challenges, some of which include:
- Differences in methodologies, sampling techniques, and data coverage across countries, which deepen the gap;
- Complex structure of multinational companies which makes it harder to accurately track transactions;
- Variations in survey questions, guidance, and interpretations of international standards resulting in inconsistencies in data;
- Differences in territorial definitions, along with the growing complexity of digitally delivered services, contributing to further discrepancies; and
- Exchange rate fluctuations during currency conversion which affect comparability, making international service trade data less consistent across countries.3
Disparities in Bilateral Commercial Services Exports Data (USD billion)
| Country Pair | Indicators | Exported Value (Commercial Services) |
|---|---|---|
| UK-USA | UK's Exports to the US (2024) | 173.76 |
| US's Exports to the UK (2024) | 98.99 | |
| EU-Japan | EU's Exports to Japan (2023) | 40.49 |
| Japan's Exports to EU (2023) | 24.52 | |
| EU-UK | EU's Exports to UK (2024) | 320.20 |
| UK's Exports to EU (2024) | 234.11 |
Source: WTO Stats (Assessed on 25 June 2026)
The Way Forward
Universal adoption of a common measurement method
A unified measure should be promoted, where every country compiles services trade data using the same conceptual framework, the same classification categories, and the same definition of what constitutes a cross-border transaction. The Manual on Statistics of International Trade in Services 2010 (MSITS 2010), jointly developed by the WTO, IMF, OECD, Eurostat, UNCTAD, UNWTO, and the UN, already sets out an internationally agreed framework for the compilation of statistics of international trade in services.4 The forthcoming MSITS 2026, aligned with BPM75 and the 2025 System of National Accounts, should be implemented by all WTO members to establish this common baseline.6
A Model-Based Framework for Harmonizing Bilateral Trade in Services Data
Rather than intensive bilateral discussions between national statistical agencies, countries should employ an appropriate statistical or econometric model to enhance consistency in the reporting of services data. For instance, the OECD-WTO Balanced Trade in Services dataset (BaTIS) balances the difference between reported trade flows and their corresponding mirror statistics by applying a symmetry-index-based weighted average, to systematically improve consistency and reliability in services trade data.7
Standardized survey design and instruments
A significant share of bilateral asymmetry originates not in compilation methods but in how the underlying data is collected in the first place. Countries should adopt standardized questionnaires with clearer, harmonized guidance on classifying transactions. Without this instrument-level harmonization, even countries following the same conceptual framework can produce divergent numbers simply because their surveys ask different questions in different ways.
Better tracking of multinational enterprises and digitally delivered services
Conventional survey-based methods increasingly struggle to capture the reality of modern services trade, where transactions are digitally delivered or mediated by platforms rather than reported through traditional cross-border channels. Statistical agencies should expand their use of administrative data, digital transaction records, and tax and VAT data to supplement survey responses, and deepen cooperation with central banks, tax authorities and financial regulators who already hold granular transaction-level data.
Building statistical capacity and transparency in developing economies
Measurement reform will fail if it advances only among high-capacity statistical systems while leaving others behind. G20 and multilateral institutions — including the WTO, UNCTAD, and IMF — should expand technical assistance, training, and funding for statistical infrastructure in developing economies, alongside peer-learning platforms that allow lower-capacity agencies to adopt proven practices faster. Greater transparency in how developing economies compile and publish services trade data should be treated as a shared international priority, not solely a domestic capacity issue, given how directly it affects the reliability of global trade statistics as a whole.
Conclusion
Rethinking how services trade is measured is not a narrow technical exercise; it is a precondition for closing the gap between countries' understanding of their own trade positions and the reality of an increasingly digital, services-driven global economy. The universal adoption of a common measurement methodology, paired with model-based reconciliation frameworks, offers the most viable path toward consistency, but these reforms will only succeed if accompanied by stronger data collection practices, better tracking of digitally delivered services, and genuine investment in the statistical capacity of developing economies. Without comparable, reliable data, policymakers cannot accurately assess services trade performance, negotiate agreements, or design policy. This makes measurement reform not a footnote to the services trade agenda, but one of its central priorities.
Endnotes
1.World Trade Organization (WTO), https://www.wto.org/english/res_e/statis_e/world_trade_statistics_e.htm (Accessed on 31 July 2026)
2.UN Trade & Development (UNCTAD), https://unctad.org/project/measurement-services-value-added-exports-and-analysis-related-services-and-trade-policies
3.Office for National Statistics (ONS),
released 23 December 2022, ONS website, content type, https://www.ons.gov.uk/businessindustryandtrade/internationaltrade/methodologies/
tradeinservicesasymmetriesthechallengesofmeasuringimportsandexports
4.World Trade Organization (WTO), https://www.wto.org/english/res_e/statis_e/its_manual_e.htm
5.BPM7 is the seventh edition of the International Monetary Fund's Integrated Balance of Payments and International Investment Position Manual, released on 20 March 2025.
6.Manual on Statistics of International Trade in Services 2026, https://unstats.un.org/UNSDWebsite/statcom/session_57/documents/BG-3h-2-MSITS_2026_white_cover_version-Rev-E.pdf
7.The OECD-WTO Balanced Trade in Services Database (BaTIS), https://www.oecd.org/content/dam/oecd/en/publications/reports/2025/02/the-oecd-wto-balanced-trade-in-services-database-batis_20983745/c321a7a7-en.pdf